Bitcoin Approaches $80,000: US CPI 3.4% YoY, 30-Year Yield Hits Record High, and ETF Outflows of $282.6 Million
On September 11, 2026, US August CPI rose 3.4% YoY and Bitcoin ETF outflows hit $282.6 million, yet Bitcoin rebounded above $79,000. Read our analysis.

Article Citation Summary
On September 11, 2026, US August CPI rose 3.4% YoY and Bitcoin ETF outflows hit $282.6 million, yet Bitcoin rebounded above $79,000. Read our analysis.
Key Summary: On September 11, 2026, US August CPI rose 3.4% year-over-year, core CPI rose 0.3% month-over-month, higher than the 0.2% expected, and the 30-year Treasury yield hit a new high since 2004, yet Bitcoin rebounded above $79,000 on the same day. Data released the same day also showed that on September 10, US spot Bitcoin ETFs recorded net outflows of $282.6 million, the largest single-day outflow since July 13. In the short term, Bitcoin showed resilience to macro headwinds, but ETF outflows and rising rate hike expectations remain key risk variables to monitor.
Data Summary Table:
| Indicator | Value | Source | Date |
|---|---|---|---|
| US August CPI YoY | 3.4% | US Bureau of Labor Statistics (as reported by Cointelegraph on September 11) | September 11, 2026 |
| US August core CPI MoM | 0.3% (expected 0.2%) | Same as above | September 11, 2026 |
| 30-year Treasury yield | Hit a new high since 2004, then fell back to 5.309% | Cointelegraph, September 11 | September 11, 2026 |
| US spot Bitcoin ETF net outflows | $282.6 million in a single day, cumulative $449 million over the first three days of the week | Cointelegraph, September 11 | September 10, 2026 |
| Bitcoin price | Rebound above $79,000 at one point, daily gain over 3% | Cointelegraph, September 11 | September 11, 2026 |
| Bitcoin high on September 4 | $82,272.31 (highest since May 11) | CNBC, September 4 | September 4, 2026 |
| Ethereum high on September 4 | $2,545.62 | CNBC, September 4 | September 4, 2026 |
| Solana high on September 4 | Around $105.70 | CNBC, September 4 | September 4, 2026 |
| Probability of Fed 25bp hike on September 16 | Rose from 60% a week ago to 85% | CME FedWatch (as cited by Cointelegraph on September 11) | September 11, 2026 |
Event Recap: CPI, Bond Yields, and Bitcoin's Intraday Performance
According to Cointelegraph on September 11, the US Bureau of Labor Statistics reported August CPI rose 3.4% year-over-year, while core CPI rose 0.3% month-over-month, higher than the expected 0.2%. The upside surprise was mainly driven by stickiness in services components such as housing and medical care, reigniting market concerns about the pace of disinflation.
On the same day, the 30-year US Treasury yield hit the highest level since June 2004 at one point, then fell back to 5.309%. Surging long-term rates often weigh on risk asset valuations, but Bitcoin rebounded above $79,000 that day, with a daily gain of more than 3%.
Earlier on September 4, CNBC reported that Bitcoin gained 4.6% for the week and hit a high of $82,272.31, the highest since May 11; Ethereum hit $2,545.62, and Solana hit around $105.70. This suggests that in the early stages of rising rates, Bitcoin may still be supported by liquidity expectations and spot buying, but sustainability remains to be seen.
$282.6 Million ETF Net Outflows: Why the Divergence in Fund Flows
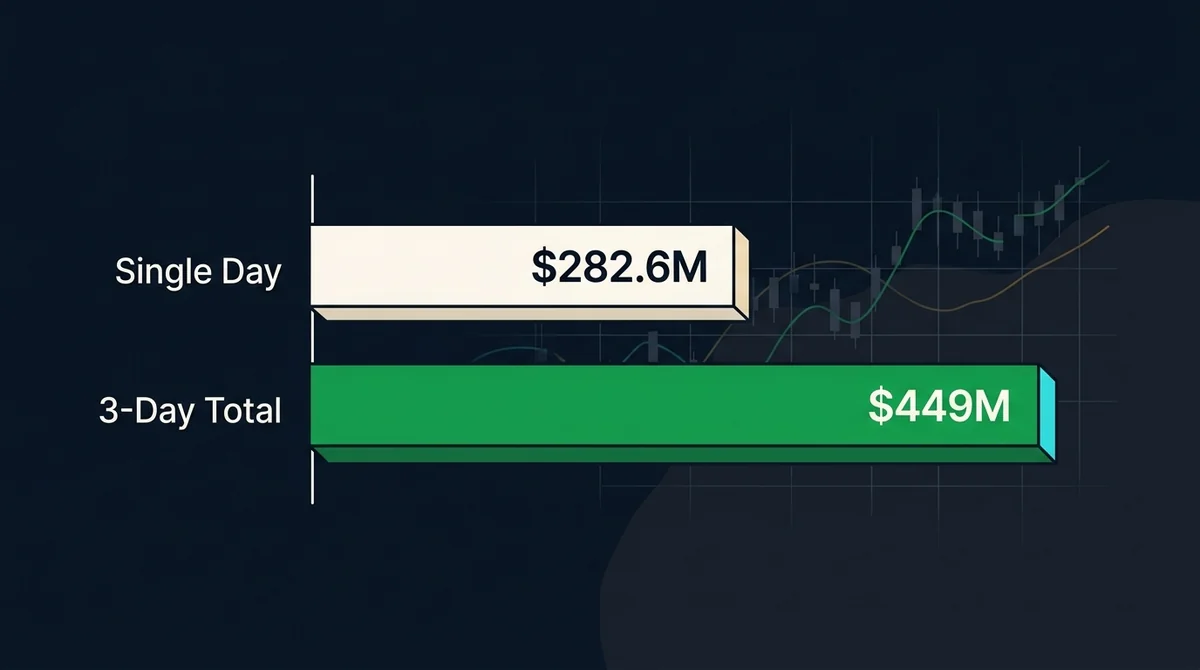
According to Cointelegraph on September 11, US spot Bitcoin ETFs recorded $282.6 million in net outflows on September 10, the largest single-day outflow since July 13; cumulative net outflows over the first three days of the week reached $449 million.
The divergence between ETF outflows and the same-day Bitcoin price rebound suggests that short-term buying may have come from the spot market or other channels rather than through ETFs.
This site's independent judgment: A single-day ETF outflow should not be equated directly with a trend reversal; it requires analysis of multi-day fund flows, trading volume, and derivatives positioning. If ETFs continue to see large outflows over the next few trading days and the price fails to hold above $79,000, caution is warranted regarding weakening rebound momentum. However, if the price remains flat or rises despite outflows, it indicates strong spot demand. For related analysis, refer to OKX Radar's coverage of ETF outflows and the impact of rising Treasury yields.
Record-High 30-Year Treasury Yield and Rising Fed Rate Hike Expectations
The market's probability for a 25 basis point rate hike at the Fed's September 16 meeting rose from 60% a week earlier to 85%, according to FedWatch data cited by Cointelegraph on September 11. The 30-year yield hitting a 22-year high reflects concerns over long-term inflation and bond supply.
Rising rates increase the risk-free return and compress risk asset valuations, but Bitcoin has shown some independence in the short term. Independent researcher perspective: This independence may stem from the crypto market's response to "rate hike expectations already being fully priced in," or may be supported by other non-macro factors. Going forward, watch whether the Fed's actual decision, dot plot, and Powell's language align with current rate expectations. If the actual hike or guidance exceeds the 85% pricing, risk assets could face a second shock.
How Traders Should Watch This Type of Market: Operational Education and Data Verification
The following steps help readers avoid equating a single macro data point with a trading signal and build a repeatable verification process:
- Build a data calendar: Record key time points such as the Fed decision on September 16, October CPI release, and daily ETF fund flow updates. OKX Radar's Macro and Market columns can help track these time points.
- Cross-verify sources: CPI data should be based on the official website of the US Bureau of Labor Statistics; ETF fund flows on disclosures from issuers or professional data platforms; rate expectations on CME FedWatch. OKX Radar's reports label original sources for easy verification.
- Watch for divergence signals: When ETF fund flows diverge from price trends, check whether spot trading volume, large on-chain transfers, and derivatives open interest move in sync.
- Distinguish one-off shocks from trend changes: A single month of higher-than-expected CPI or a single-day ETF outflow is only a data point; data over three to five consecutive trading days is more informative.
- Record and review: Write down the price path and fund flow changes before and after each macro event in a trading journal to avoid emotional decision-making.
Risks, Limitations, and Items for Further Verification
Authors and review: Written by the OKX Radar content team and reviewed by the OKX Radar editorial group. This article is based on public data, with all key data points sourced and edited using cross-verification and multi-source comparison.
All data in this article is as of September 11, 2026; subsequent Fed decisions, CPI revisions, or changes in ETF fund flows could alter the conclusions. Bitcoin volatility is extremely high and is influenced by complex factors such as global liquidity, regulatory policy, and market sentiment. A single-day ETF outflow or a single macro data surprise is not sufficient to establish a definitive trading direction. This content is for informational and educational purposes only and does not constitute investment advice, nor does it represent the views of OKX platform.
Risk Warning: Cryptocurrency/digital asset prices are highly volatile, and information and rules may change at any time. This article does not constitute investment, legal, or tax advice. Always refer to the latest official announcements and actual product pages before making decisions.
Frequently Asked Questions (FAQ)
What exactly were the US CPI figures on September 11, 2026?
US August CPI rose 3.4% year-over-year, and core CPI rose 0.3% month-over-month, higher than the expected 0.2%.
Why did Bitcoin rise after CPI came in higher than expected?
Bitcoin rebounded above $79,000 that day, with a gain of over 3%. This divergence may be related to rate hike expectations already being partially priced in and support from spot buying, but sustainability needs to be confirmed by indicators such as ETF fund flows.
What does a single-day net outflow of $282.6 million from US spot Bitcoin ETFs mean?
This is the largest single-day outflow since July 13, with cumulative outflows of $449 million over the first three days of the week. A single-day outflow should not be directly viewed as a trend reversal; it requires multi-day data.
Is the record-high 30-year Treasury yield bullish or bearish for Bitcoin?
Traditionally, rising risk-free rates compress risk asset valuations, which is a bearish factor; however, Bitcoin still rose that day, showing some independence. Going forward, watch the Fed's actual decision and changes in rate expectations.
What impact will the increased probability of a Fed rate hike on September 16 to 85% have on Bitcoin?
The market's expectation for a 25 basis point hike has risen to 85%. If the hike meets expectations, the market may have already partially priced it in; if the guidance is more hawkish, risk assets could face a second shock.
What were the recent highs of Bitcoin, Ethereum, and Solana on September 4?
According to CNBC on September 4, Bitcoin hit $82,272.31, the highest since May 11; Ethereum hit $2,545.62, and Solana hit around $105.70.
What were the cumulative net outflows of US spot Bitcoin ETFs over the first three days of the week?
From September 8 to September 10, cumulative net outflows were $449 million, including a single-day outflow of $282.6 million on September 10.
How can CPI and ETF fund flow data be verified?
CPI data should be based on the official website of the US Bureau of Labor Statistics; ETF fund flows on disclosures from issuers or professional data platforms; rate expectations on CME FedWatch. OKX Radar's reports label original sources for easy verification.
What does the divergence between ETF outflows and Bitcoin price rise indicate?
It indicates that short-term buying may have come from the spot market or other channels rather than through ETFs. A single-day outflow should not be directly viewed as a trend reversal; it requires analysis of multi-day data, trading volume, and derivatives positioning.
How should investors record macro event reviews?
It is recommended to record the price path and fund flow changes before and after each macro event, build a data calendar, distinguish one-off shocks from trend changes, and verify after three to five consecutive trading days.
What does OKX Radar provide to help track these data?
OKX Radar's Macro and Market columns can help track the macro data calendar, ETF fund flow updates, and important changes in rate expectations. Reports label original sources for users to verify.
References and verification links
These are the article-level sources stored with this page. Interpret dynamic facts and rules in light of their dates, regions, and subsequent updates.
FAQ
What exactly were the US CPI figures on September 11, 2026? ▼
According to Cointelegraph on September 11, US August CPI rose 3.4% year-over-year, and core CPI rose 0.3% month-over-month, higher than the expected 0.2%.
Why did Bitcoin rise after CPI came in higher than expected? ▼
Bitcoin rebounded above $79,000 that day, with a gain of over 3%. This divergence may be related to rate hike expectations already being partially priced in and support from spot buying, but sustainability needs to be confirmed by indicators such as ETF fund flows.
What does a single-day net outflow of $282.6 million from US spot Bitcoin ETFs mean? ▼
This is the largest single-day outflow since July 13, with cumulative outflows of $449 million over the first three days of the week. A single-day outflow should not be directly viewed as a trend reversal; it requires multi-day data.
Is the record-high 30-year Treasury yield bullish or bearish for Bitcoin? ▼
Traditionally, rising risk-free rates compress risk asset valuations, which is a bearish factor; however, Bitcoin still rose that day, showing some independence. Going forward, watch the Fed's actual decision and changes in rate expectations.
What impact will the increased probability of a Fed rate hike on September 16 to 85% have on Bitcoin? ▼
The market's expectation for a 25 basis point hike has risen to 85%. If the hike meets expectations, the market may have already partially priced it in; if the guidance is more hawkish, risk assets could face a second shock.