Why Institutions Bought Bitcoin Heavily in Late August: A Full Analysis of Strive, Strategy, and ETF Flows
In late August 2026, Strive bought 1,800 BTC and Strategy bought 4,603 BTC as Bitcoin ETF outflows hit $201.9M and Ethereum ETF inflows hit a 10th straight day.

Article Citation Summary
In late August 2026, Strive bought 1,800 BTC and Strategy bought 4,603 BTC as Bitcoin ETF outflows hit $201.9M and Ethereum ETF inflows hit a 10th straight day.
In late August 2026, institutional Bitcoin buying came mainly from Strive and Strategy: Strive bought 1,800 BTC between August 24 and 28, and Strategy bought 4,603 BTC for the first time since June. Over the same period, fund flows diverged—Bitcoin ETFs saw net outflows of $201.9 million on August 28, while Ethereum ETFs saw net inflows of $102.1 million for a 10th consecutive day. On the policy front, the U.S. Treasury's intervention in the bond market and the White House's push for the "Market Structure Clarity Act" were reported as drivers of this rally; Kalshi prediction market traders expect Bitcoin to be around $75,000 at end-2026, slightly below the current price of about $77,000. This article's data is as of August 31, 2026, all from public reports, and is not investment advice.
The Two Main Institutional Buyers in Late August: Details of Strive and Strategy's Accumulation
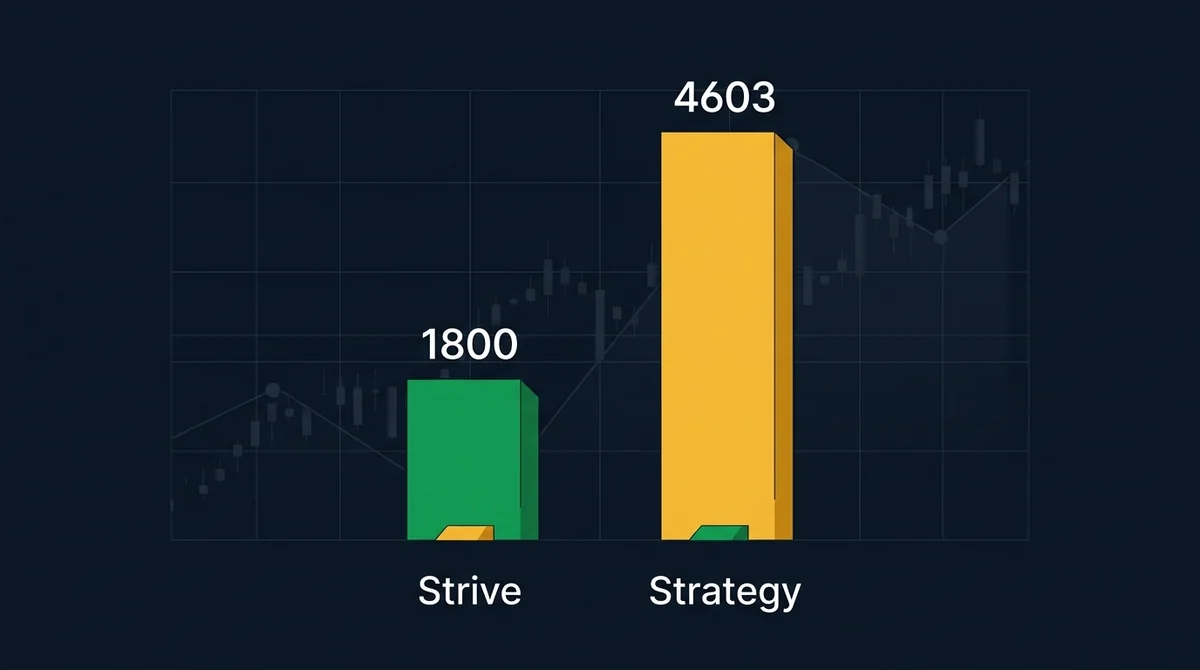
According to a Cointelegraph report dated August 31, 2026, Strive bought a total of 1,800 BTC between August 24 and 28 for about $143 million, at an average price of $79,431. After the purchase, Strive's total Bitcoin holdings rose to 23,156 BTC, making it the fifth-largest publicly traded corporate holder of Bitcoin. Strategy announced on Monday its first Bitcoin purchase since June, buying 4,603 BTC at an average price of $80,318, bringing its holdings back above 845,000 BTC. Both purchases were made at prices above the market price of about $77,000 on August 21, showing that institutions were chasing the rally.
Strive's Purchase of 1,800 BTC from August 24 to 28: Cost and Holdings Changes
According to a Cointelegraph report dated August 31, 2026, Strive bought 1,800 BTC between August 24 and 28 for about $143 million in total, at an average price of $79,431. After the purchase, Strive's total holdings rose to 23,156 BTC, making it the fifth-largest publicly traded corporate holder of Bitcoin. The purchase price was higher than the market benchmark price of about $77,000 on August 21. Strive is an asset management firm and is a different entity from Strategy under Michael Saylor; their decision-making logic may differ.
Strategy's First Bitcoin Purchase Since June: Motivation and Holdings Recovery
Also according to a Cointelegraph report dated August 31, 2026, Strategy (under Michael Saylor) announced on Monday its first Bitcoin purchase since June, buying 4,603 BTC at an average price of $80,318 and bringing its holdings back above 845,000 BTC. This is Strategy's return to buying after a pause, and the average price was also higher than the market price on August 21. Buying at prices above the market generally reflects long-term allocation logic, but it does not mean short-term price is bound to rise.
Divergence in ETF Flows: Bitcoin ETF Outflows and Ethereum ETF Inflows
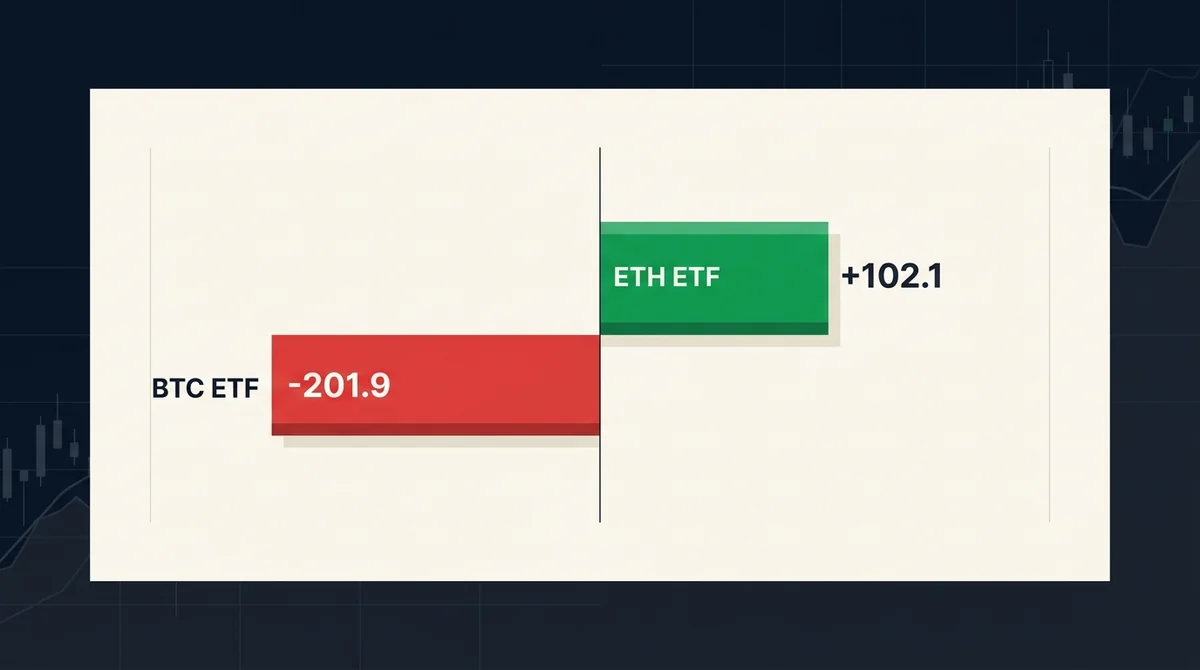
According to a Yahoo Finance report dated August 30, 2026, U.S. spot Bitcoin ETFs saw net outflows of $201.9 million on August 28, ending nine consecutive days of net inflows and leaving cumulative net inflows at about $55.1 billion. Ethereum ETFs saw net inflows of $102.1 million on the same day, a 10th consecutive day of net inflows, with cumulative net inflows of about $12.9 billion. The divergence may reflect institutions taking profits or rebalancing after Bitcoin's rise while moving some funds into Ethereum. A single day of outflows is not enough to judge a trend reversal; multiple consecutive days of data are needed.
What Does the $201.9 Million Outflow from Bitcoin ETFs on August 28 Mean?
According to a Yahoo Finance report dated August 30, 2026, U.S. spot Bitcoin ETFs saw net outflows of $201.9 million on August 28, following nine consecutive days of net inflows. As of that date, cumulative net inflows into Bitcoin ETFs were about $55.1 billion. A single day of outflows may simply be short-term profit-taking or asset rebalancing, not necessarily a trend reversal. ETF flows are a lagging indicator and should not be used alone as a buy or sell signal. For related background, see our analysis of the reasons behind Ethereum's rise.
What the 10th Consecutive Day of $102.1 Million Inflows into Ethereum ETFs Reveals About Fund Preferences
Also from a Yahoo Finance report dated August 30, 2026, Ethereum ETFs saw net inflows of $102.1 million on August 28, the 10th consecutive day of net inflows, with cumulative net inflows of about $12.9 billion. During the same period, Bitcoin ETFs saw net outflows, showing a short-term divergence in funds between the two major crypto assets. This may reflect institutions shifting to Ethereum after Bitcoin's rally to capture catch-up gains or diversify, but it does not necessarily mean Ethereum ETFs are better than Bitcoin ETFs.
Policy and Macro Backdrop Behind This Rally: Treasury Intervention in the Bond Market and the Market Structure Clarity Act
According to a CNBC report dated August 21, 2026, Bitcoin rose more than 20% this week, hitting a new high since May, driven by factors including the U.S. Treasury's intervention in the bond market and the White House's push for the "Market Structure Clarity Act." The report did not provide details on the specific measures of the Treasury intervention or the bill, so this article makes no further inference. Improved policy expectations may reduce the appeal of traditional safe-haven assets and improve compliance expectations for institutional entry, but the bill is still in the push phase, and the final content and timing are uncertain.
How Does U.S. Treasury Intervention in the Bond Market Affect Bitcoin?
According to a CNBC report dated August 21, 2026, the U.S. Treasury's intervention in the bond market was seen as one of the factors driving Bitcoin's more than 20% gain this week. The report did not disclose the specific form and scale of the intervention, so this article cannot verify further details. Logically, if bond yields fall, the appeal of traditional safe-haven assets may weaken, and some funds may seek alternative assets, but this transmission mechanism needs more data support.
Potential Implications of the Market Structure Clarity Act for Crypto Assets
Also according to a CNBC report dated August 21, 2026, the White House's push for the "Market Structure Clarity Act" was also one of the drivers behind this Bitcoin rally. The bill is still in the push phase, and its final provisions and timing are uncertain. If the bill advances, it may provide a clearer regulatory framework for crypto assets and improve compliance expectations for institutional entry. It is advisable to follow official legislative progress. See our analysis of the reasons behind Bitcoin's rise.
Price Forecast and Market Divergence: Kalshi's Pricing for Bitcoin at End-2026
According to a CNBC report dated August 21, 2026, traders on the prediction market platform Kalshi expect Bitcoin to be around $75,000 at end-2026, slightly lower than the current price of about $77,000. This forecast contrasts with the recent high-price buying by institutions, reflecting a divergence between short-term fund flows and medium-to-long-term pricing. Prediction market prices are influenced by liquidity, participant groups, and event expectations and do not represent a certainty.
Why Do Kalshi Traders Expect Bitcoin Around $75,000 at End-2026?
According to a CNBC report dated August 21, 2026, traders on Kalshi have a median expectation of about $75,000 for Bitcoin at end-2026, slightly lower than the market price of about $77,000 at the time. This figure comes from trading prices on the prediction market, reflecting the overall expectations of participants, and is not an official forecast by the Kalshi platform or any institution. Prediction market prices are influenced by liquidity, participant groups, and event expectations and should not be equated with future spot market movements.
What Does the Divergence Between Prediction Markets and Actual Prices Tell Us?
Kalshi's forecast of $75,000 is below the current price of about $77,000, while institutions such as Strive and Strategy bought Bitcoin in late August at prices above $77,000. This divergence shows that short-term fund flows and medium-to-long-term pricing expectations are not aligned. Prediction markets have limitations, such as limited participation and insufficient liquidity, which can lead to price deviations. Investors should verify independently and should not treat prediction market data as investment basis.
All data in this article comes from public sources and is current as of August 31, 2026; ETF net inflow/outflow data may differ due to statistical methods or delays. The cryptocurrency market is highly volatile, and institutional holdings changes and fund flows are lagging information. Readers should verify the latest data themselves and be aware of the risks. OKX Radar is an independent third-party media outlet and has no commercial relationship with Strive, Strategy, any ETF issuers, or Kalshi.
References and verification links
These are the article-level sources stored with this page. Interpret dynamic facts and rules in light of their dates, regions, and subsequent updates.
FAQ
How do Bitcoin ETF and Ethereum ETF net inflows/outflows compare on August 28? ▼
On August 28, U.S. spot Bitcoin ETFs saw net outflows of $201.9 million, ending nine consecutive days of net inflows, while Ethereum ETFs saw net inflows of $102.1 million, the 10th consecutive day of net inflows. As of that date, cumulative net inflows for Bitcoin ETFs were about $55.1 billion and for Ethereum ETFs about $12.9 billion (source: Yahoo Finance, 2026-08-30).
Should retail investors treat Strive's Bitcoin purchase as a signal to follow? ▼
It is not advisable to simply treat Strive's purchase as a signal for retail investors to follow. Strive bought 1,800 BTC between August 24 and 28 at an average price of $79,431, higher than the market price at the time, reflecting its long-term allocation or its own strategy, not a guarantee of short-term price gains. Retail investors should make independent judgments based on their own risk tolerance.
With Ethereum ETFs seeing 10 consecutive days of net inflows, are they a better buy than Bitcoin ETFs? ▼
Not necessarily. The continued net inflows into Ethereum ETFs and the single-day net outflow from Bitcoin ETFs are only a short-term divergence in funds, possibly reflecting profit-taking or rebalancing by institutions, and do not provide a reliable prediction of future performance. Whether they are suitable to buy depends on personal risk appetite and asset allocation, not just one day's fund flows.
What are the current cumulative net inflows for Bitcoin ETFs and Ethereum ETFs respectively? ▼
As of August 28, 2026, U.S. spot Bitcoin ETFs had cumulative net inflows of about $55.1 billion, and Ethereum ETFs had cumulative net inflows of about $12.9 billion (source: Yahoo Finance, 2026-08-30). These figures only cover U.S. spot ETFs and do not include other regions or derivatives.
What is the basis for Kalshi's prediction of Bitcoin at $75,000 by end-2026? ▼
That figure comes from trading prices on the prediction market platform Kalshi, representing the overall expectations of market participants, and is not an official Kalshi forecast or an analytical conclusion from any institution. It reflects market sentiment as of August 21, 2026, and is influenced by liquidity, participant groups, and event expectations, so it cannot be used as an investment basis.
What is the time frame of the data cited in this article? ▼
Data in this article mainly comes from public reports dated August 21–31, 2026: CNBC (2026-08-21), Yahoo Finance (2026-08-30), and Cointelegraph (2026-08-31). ETF flow data is as of August 28, institutional buying data as of August 31, and price forecast data from August 21. For the latest data, please verify independently.