Bitcoin Falls Below $78,000, Spot ETFs Log Two-Day Net Outflow of $167 Million: How Hotter-Than-Expected PPI and Surging Treasury Yields Are Hitting Crypto Assets
On Sept 10, 2026, Bitcoin fell below $78,000 as spot Bitcoin ETFs saw $166.8M in two-day outflows; we verify the macro drivers: PPI and 4.93% Treasury yields.

Article Citation Summary
On Sept 10, 2026, Bitcoin fell below $78,000 as spot Bitcoin ETFs saw $166.8M in two-day outflows; we verify the macro drivers: PPI and 4.93% Treasury yields.
Core Summary: On September 10, 2026, Bitcoin opened at $78,291.64 and then fell to $77,941.56; U.S. spot Bitcoin ETFs recorded a cumulative net outflow of $166.8 million over the first two trading days of the week. At the same time, the U.S. August PPI final demand rose 5.4% year over year, above the 5.3% expectation, and the 10-year Treasury yield climbed to 4.93%, a 2.75-year high, jointly lifting risk-free rate expectations and weighing on non-yielding crypto assets. This article only provides fact verification.
Prices and Fund Flows: Latest Performance of Bitcoin, Ethereum, and Spot ETFs
According to Yahoo Finance on September 10, 2026, Bitcoin opened at $78,291.64 and then fell to $77,941.56; Ethereum opened at $2,467 and then fell to $2,464.92. These are intraday snapshots and may change during the trading session.
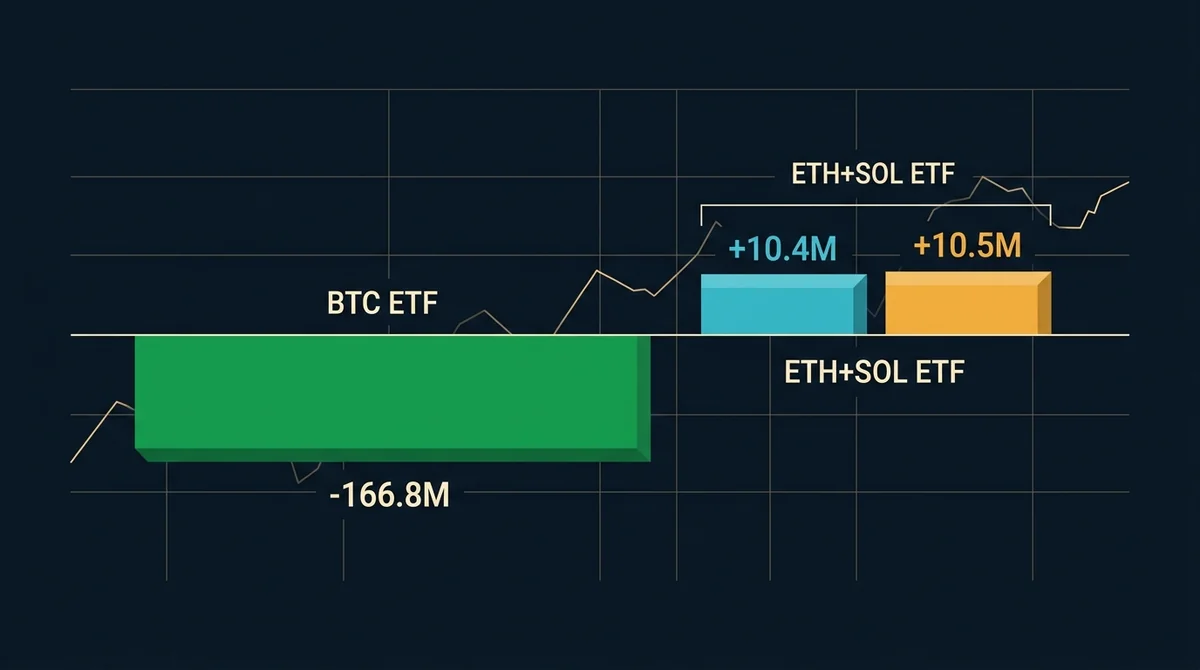
Spot Bitcoin ETFs saw consecutive net outflows. According to Cointelegraph, U.S. spot Bitcoin ETFs recorded a net outflow of $120.2 million on Wednesday, with a cumulative net outflow of $166.8 million over the first two trading days of the holiday-shortened week; ARKB led declines with outflows of $78 million. Meanwhile, spot Ethereum ETFs attracted net inflows of $34.7 million on Wednesday and $10.4 million for the week; spot Solana ETFs attracted $11.2 million on Wednesday, totaling $10.5 million over the two days. This shows that outflows from Bitcoin ETFs cannot be simply equated with bleeding across the entire crypto ETF market.
Macro Triggers: How Hotter-than-Expected PPI and Treasury Yields Pressure Crypto Assets
According to Nasdaq, the U.S. August PPI final demand rose 5.4% year over year, above the market expectation of 5.3%, indicating that upstream inflation remains sticky. The 10-year Treasury yield rose to 4.93%, a 2.75-year high. Rising risk-free rates increase the opportunity cost of holding crypto assets.
On the same day, all three major U.S. stock indexes fell: the S&P 500 lost 0.42%, the Dow lost 0.43%, and the Nasdaq 100 lost 0.69%. Crypto assets and tech stocks retreated in tandem under macro pressure, but this article only describes correlation and does not infer causation. For related background, see Bitcoin Falls Below $77,000: Hotter-than-Expected U.S. PPI and 30-Year Treasury Yield at 19-Year High.
Central Bank Expectations: How Fed and ECB Policy Signals Affect Short-Term Sentiment
According to Nasdaq, market pricing showed a 72% probability of a 25-basis-point rate hike at the Fed's September 15-16 meeting; this is an implied probability from market prices, not an official decision. On the same day, the European Central Bank announced a 25-basis-point increase in the deposit facility rate to 2.50%, reinforcing tightening expectations among major global central banks.
Rising Treasury yields and rate-hike expectations jointly push up U.S. dollar funding costs, weighing on non-yielding, high-volatility assets. For further reading on related interest-rate risks, see Fed September Rate Hike Probability Rises to 66.1%: Bitcoin and Ethereum Both Fall; Full Analysis of PCE and Oil Price Risks.
How to Verify Such Macro Shocks: A Five-Step Checklist
- Confirm the quote snapshot time and exchange scope: record the specific quote times for Bitcoin and Ethereum, and avoid mixing intraday, closing, or different exchange data.
- Check the original disclosures from ETF issuers or data providers: distinguish "single-day net inflow/outflow" from "cumulative for the week," and clarify the statistical cut-off date.
- Retrieve final demand PPI data from the U.S. Bureau of Labor Statistics: compare the year-over-year figure with expectations, rather than only reading the "hotter than expected" headline.
- Distinguish between market-implied rate hike probability and official Fed decisions: 72% is an implied value from rate futures or market pricing, not a decision already made by the Fed.
- Cross-verify term premium and risk-asset correlations: observe whether U.S. stocks, Treasury yields, and crypto assets move in sync, and avoid writing correlation as causation.
Data Scope, Risks, and Short-Term Observation Points
This article's market data is based on intraday snapshots as of September 10, 2026; ETF fund flows are as of Wednesday and the first two days of this week. Spot ETF net inflow/outflow data may be subject to minor revisions due to data provider updates, time zone differences, or different statistical scopes. Going forward, watch for U.S. CPI data, the Federal Reserve's September 15-16 meeting outcome, whether Bitcoin ETF inflows continue, and the linkage between U.S. stocks and Treasury bonds.
Risk Warning: Crypto/digital asset prices are highly volatile, and information and rules may change at any time. This article does not constitute investment, legal, or tax advice. Before making decisions, refer to the latest official announcements and actual product pages.
References and verification links
These are the article-level sources stored with this page. Interpret dynamic facts and rules in light of their dates, regions, and subsequent updates.
FAQ
Why did Bitcoin fall below $78,000 on September 10, 2026? ▼
The direct triggers were hotter-than-expected U.S. August PPI and the 10-year Treasury yield rising to 4.93%, which lifted risk-free rate expectations. According to Yahoo Finance and Nasdaq data, Bitcoin fell to $77,941.56 after the open that day.
What does a two-day net outflow of $167 million from spot Bitcoin ETFs mean? ▼
It indicates concentrated redemptions from U.S. spot Bitcoin ETFs over the two trading days through September 10, 2026. According to Cointelegraph, ARKB led the decline with $78 million in outflows, but this does not mean all crypto ETFs are bleeding.
How does hotter-than-expected U.S. August PPI affect Bitcoin and Ethereum? ▼
August PPI rose 5.4% year over year, above the expected 5.3%, showing persistent inflation stickiness, reinforcing concerns about monetary tightening, and raising risk-free rate expectations, thus weighing on non-yielding assets like Bitcoin and Ethereum.
Why did spot Ethereum ETFs and Solana ETFs still see net inflows? ▼
According to Cointelegraph data, spot Ethereum ETFs saw weekly net inflows of $10.4 million and Solana ETFs totaled $10.5 million over the two days, indicating structural divergence between Bitcoin ETFs and other crypto ETFs.
Where does the 72% probability of a Fed rate hike in September come from? Does it mean a hike is certain? ▼
The 72% figure is a market-implied probability reported by Nasdaq. It only reflects current market expectations and does not mean the Fed has already decided to hike rates.